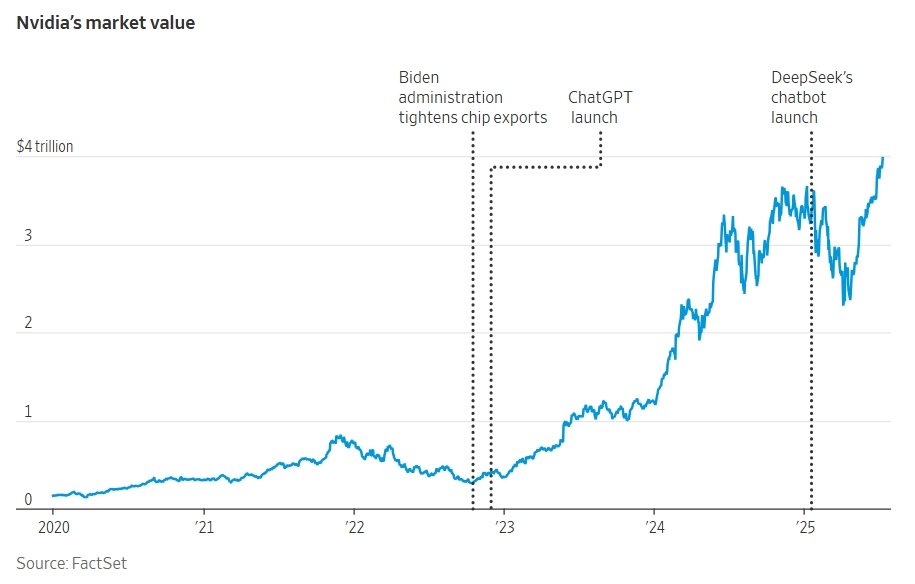
Nvidia crosses $4 trillion market value
I created charts for breaking coverage of Nvidia crossing $4 trillion in market value.
My role: I designed and built the charts, working with the reporter and editors on the timeline and callouts.
Reporter + Developer
I combine reporting judgment and technical execution to make complex topics clear through writing, analysis, graphics, and interactive storytelling.
Get in touchSelected work
I created charts for breaking coverage of Nvidia crossing $4 trillion in market value.
My role: I designed and built the charts, working with the reporter and editors on the timeline and callouts.
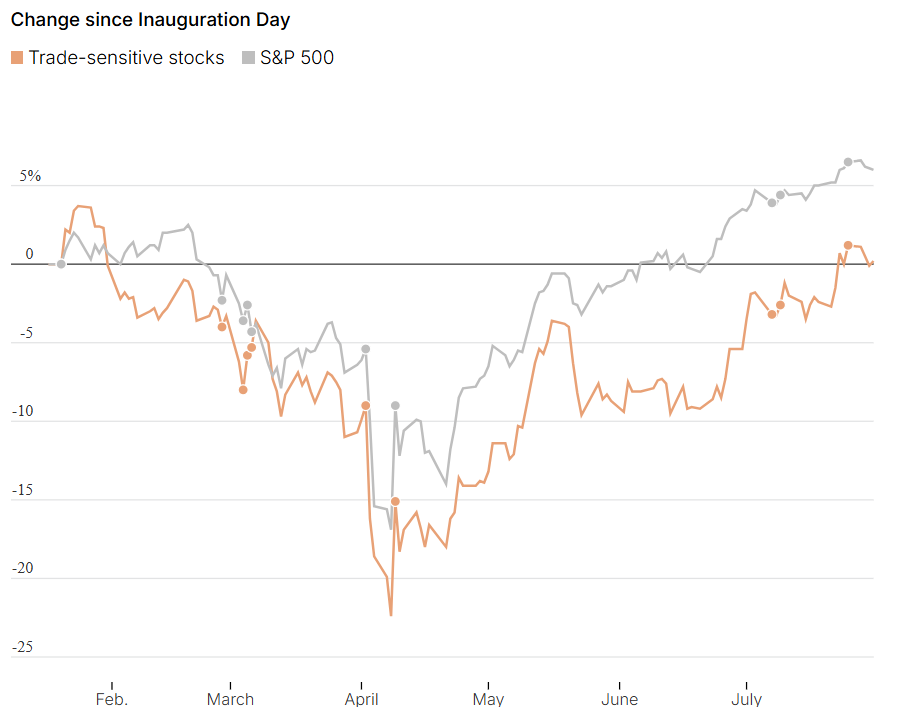
An interactive chart comparing changes in trade-sensitive stocks with the S&P 500 after Inauguration Day.
My role: I built the interactive with data supplied by the data team and implemented it in our WSJ style template.
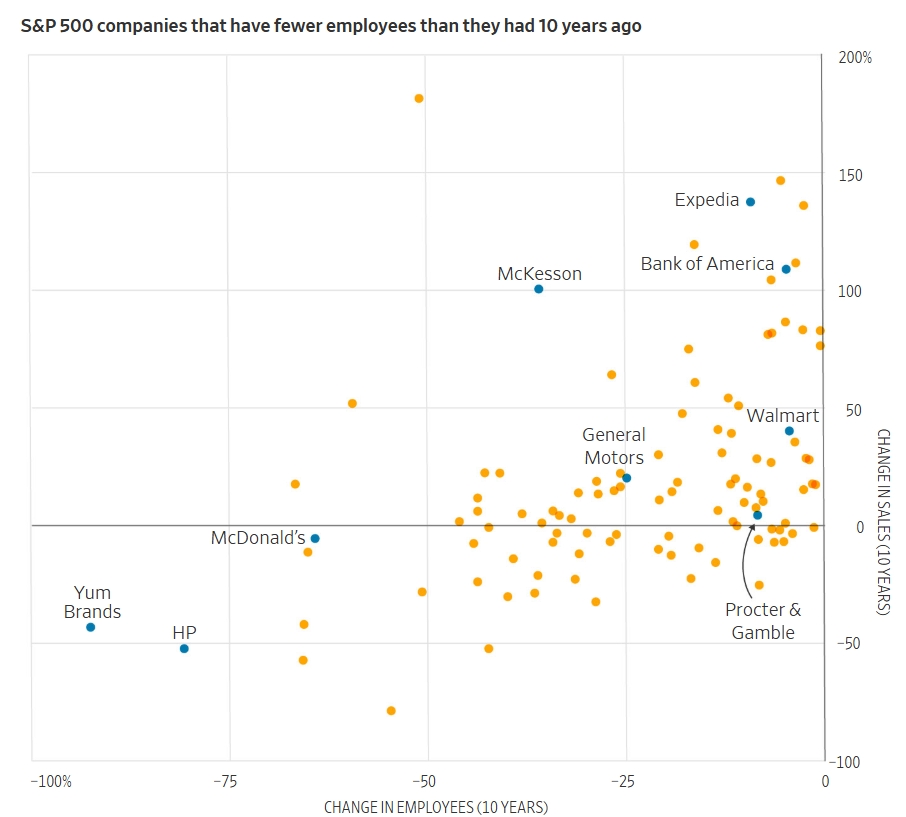
I analyzed how sales and employment changed over time at some of America’s largest companies.
My role: I worked with the reporter and editor to explore the data, shape the analysis, and build graphics for the story.
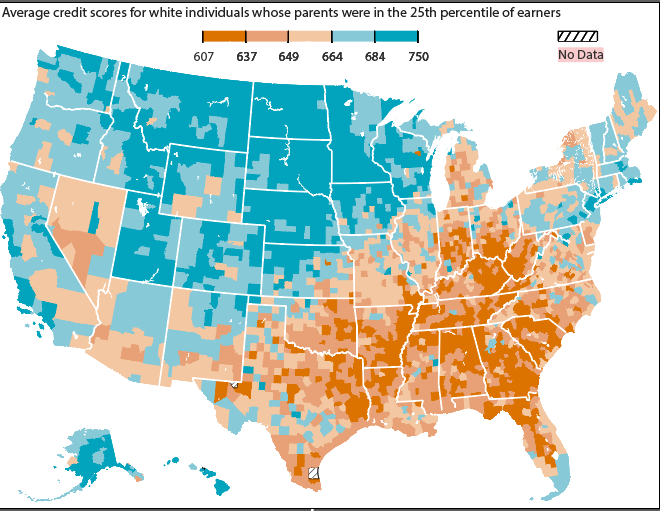
I created county-level maps showing how credit scores varied with people’s childhood neighborhoods.
My role: I built the maps using QGIS and WSJ’s map templates and visual style.
More work
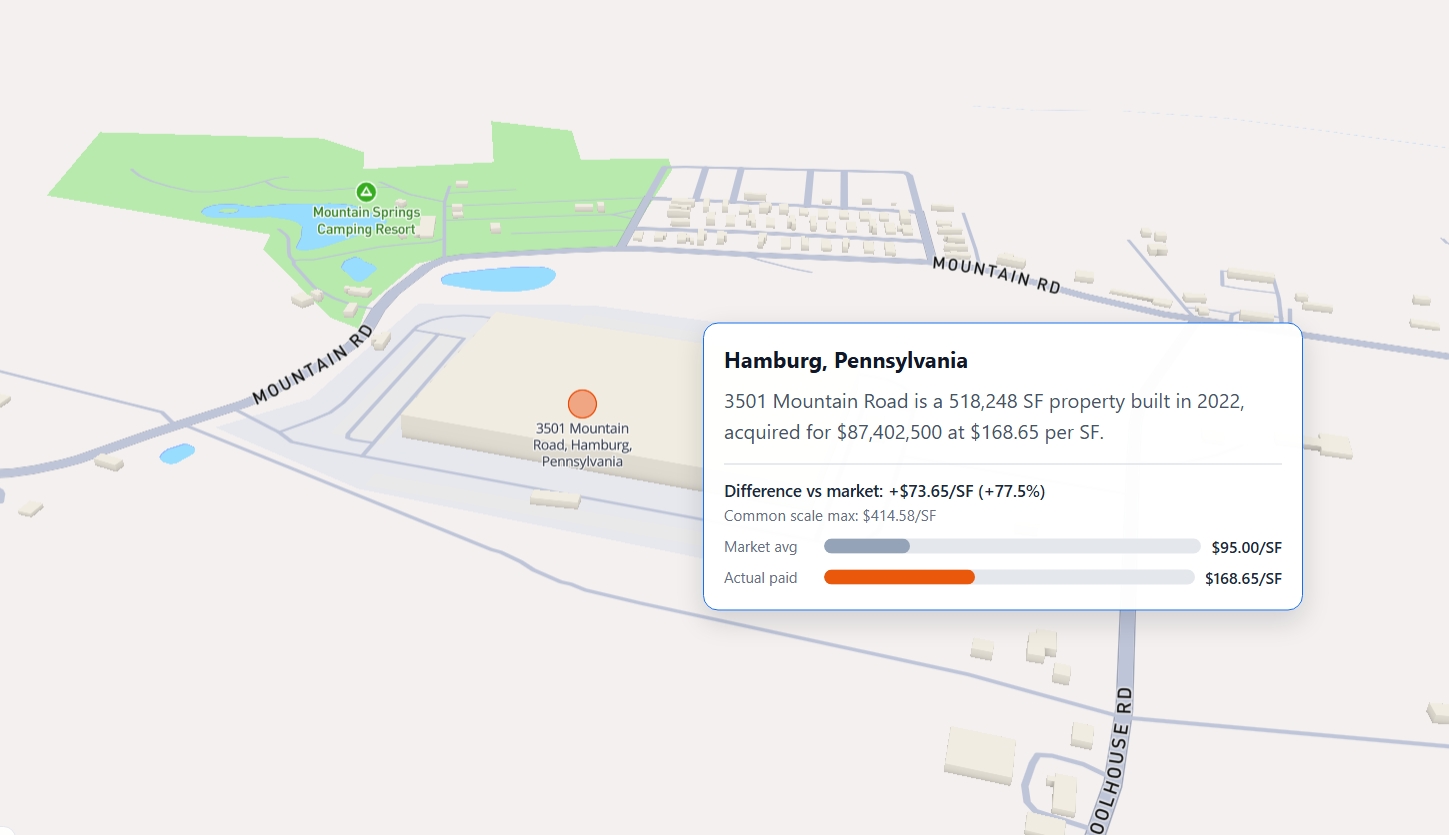
A reusable Mapbox scrollytelling template, built around an example mapping ICE-linked warehouse acquisitions across the United States.
My role: I built the template with Mapbox, JavaScript, HTML, and CSS, including custom map styles and layers.
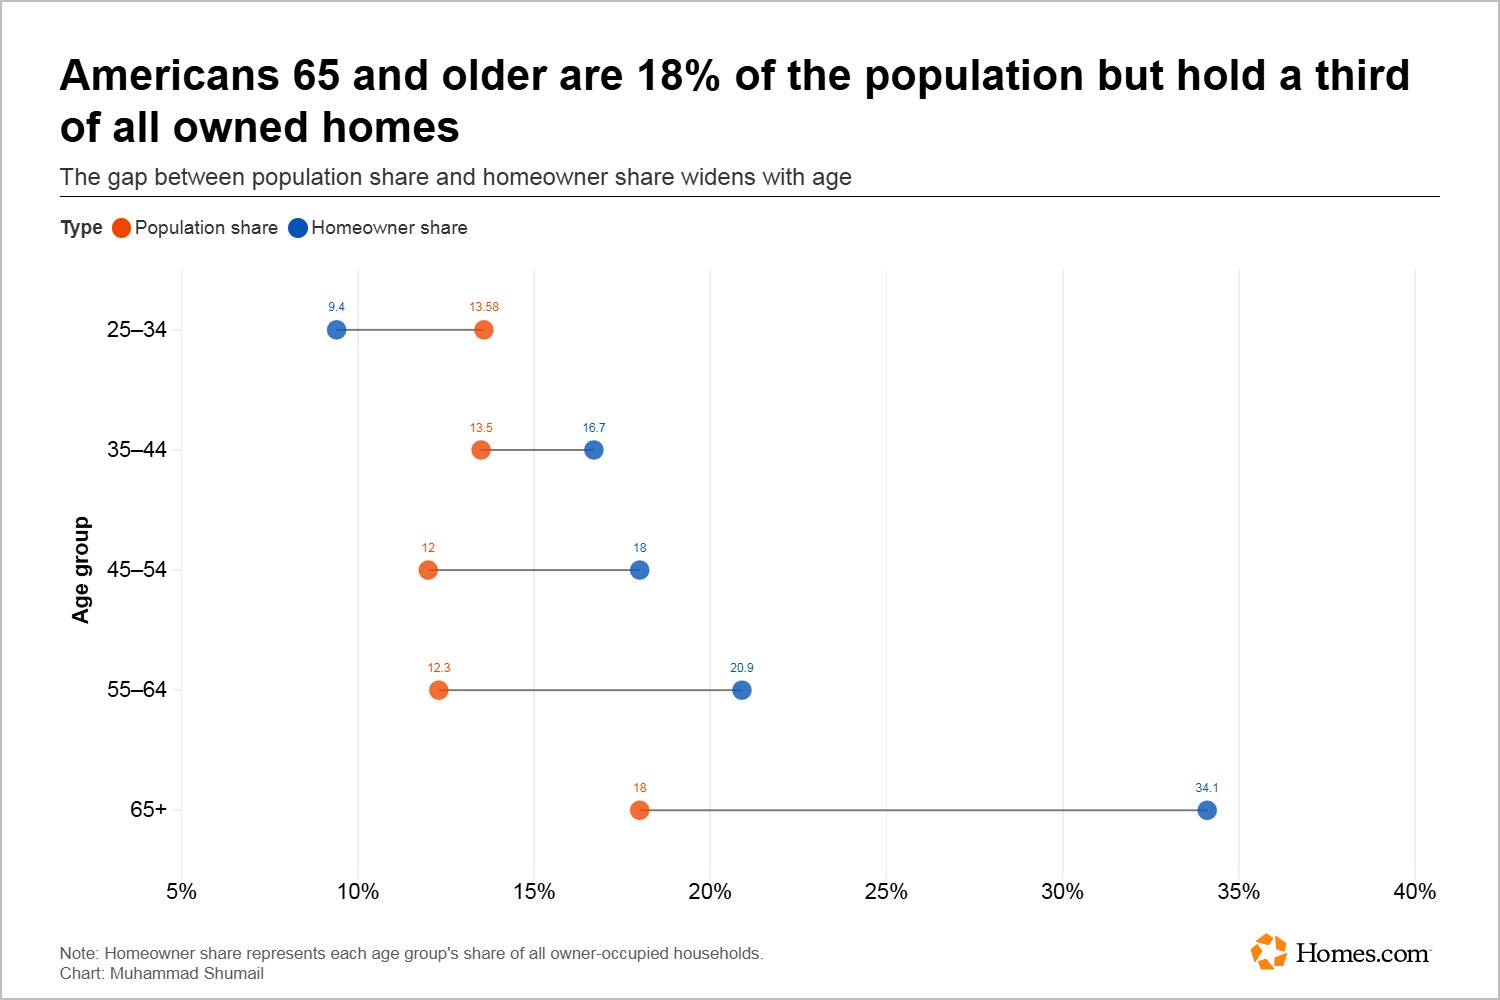
15,000+ views · Enterprise Story of the Month
I pitched a story about how homes owned by older Americans could affect housing markets differently across the country.
My role: I pitched the story, found and analyzed the data, and built a map, dot plot, and quadrant chart.
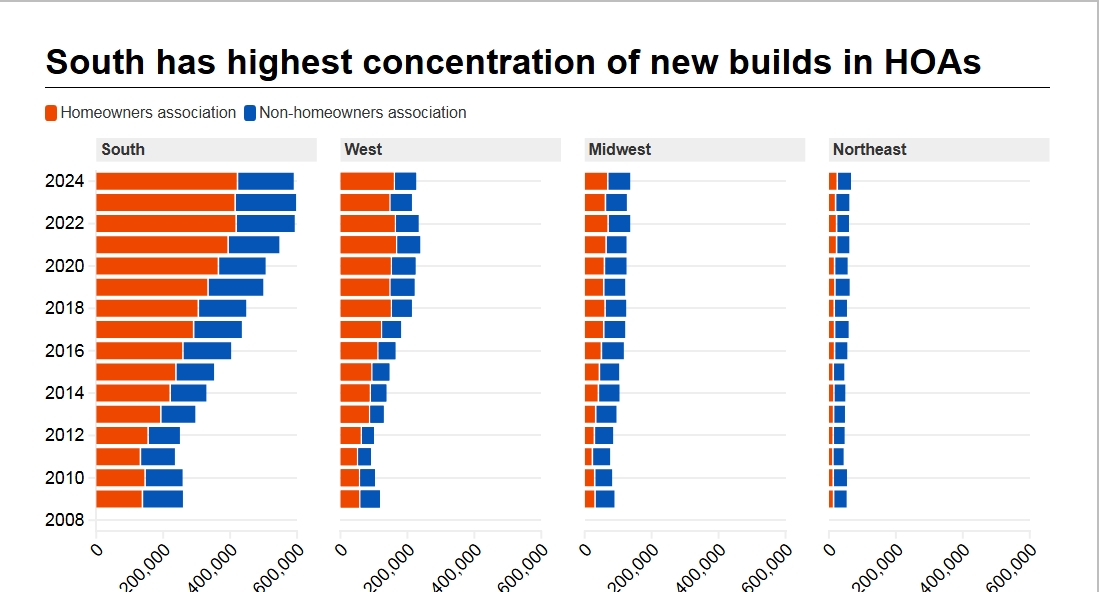
A series of charts showing how HOA construction and home sales have changed over time, across regions, and at different price points.
My role: I requested the data from NAHB, analyzed it, and built the charts in Flourish.
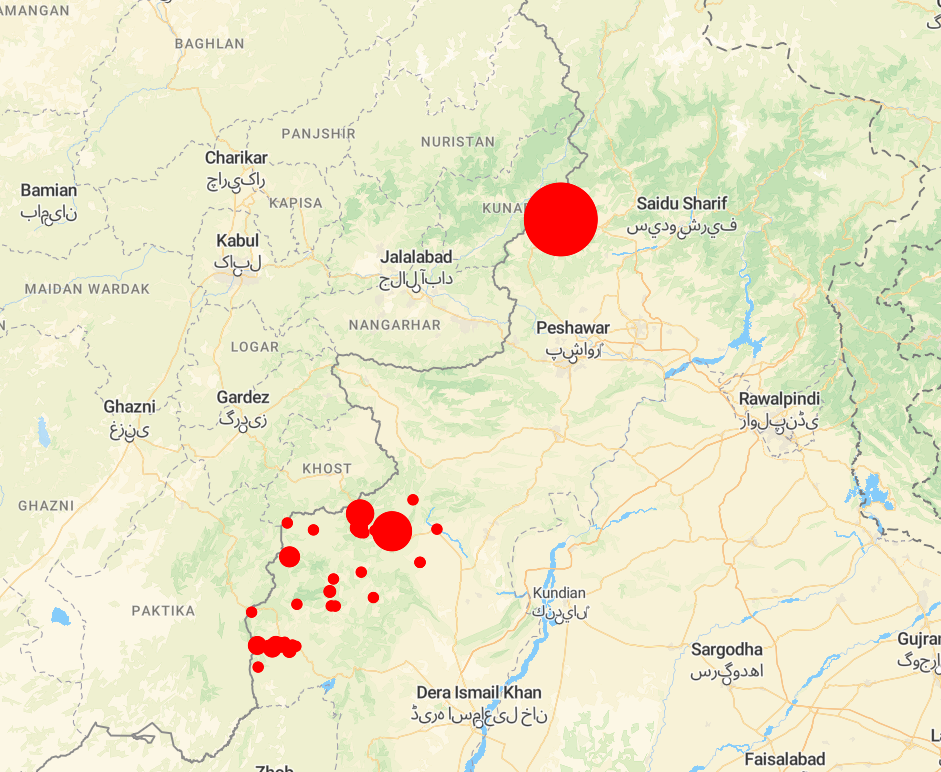
An independent capstone mapping drone strikes in Pakistan, their locations, and reported civilian deaths.
My role: I found the data, contacted two independent nonprofits tracking strikes and civilian deaths, and built the project.
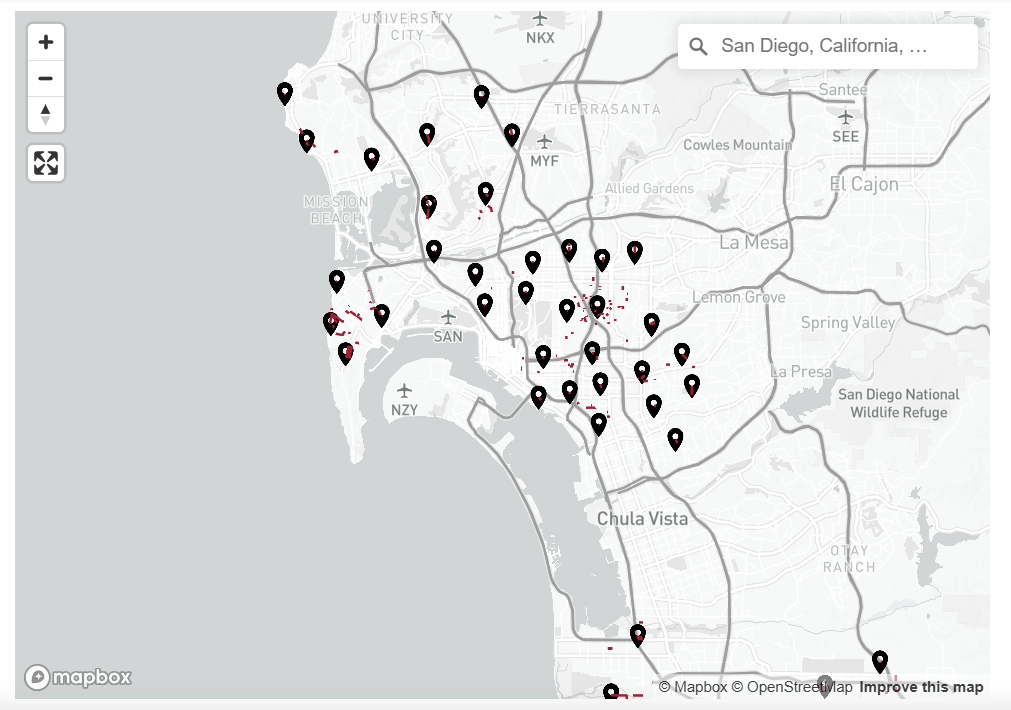
An interactive map helping residents find unpaved roads near them in San Diego County.
My role: I suggested adding an interactive map so readers could find the roads rather than relying on text descriptions alone. I found the GeoJSON files and coordinates, mapped the roads in Mapbox, and added search and popup features.
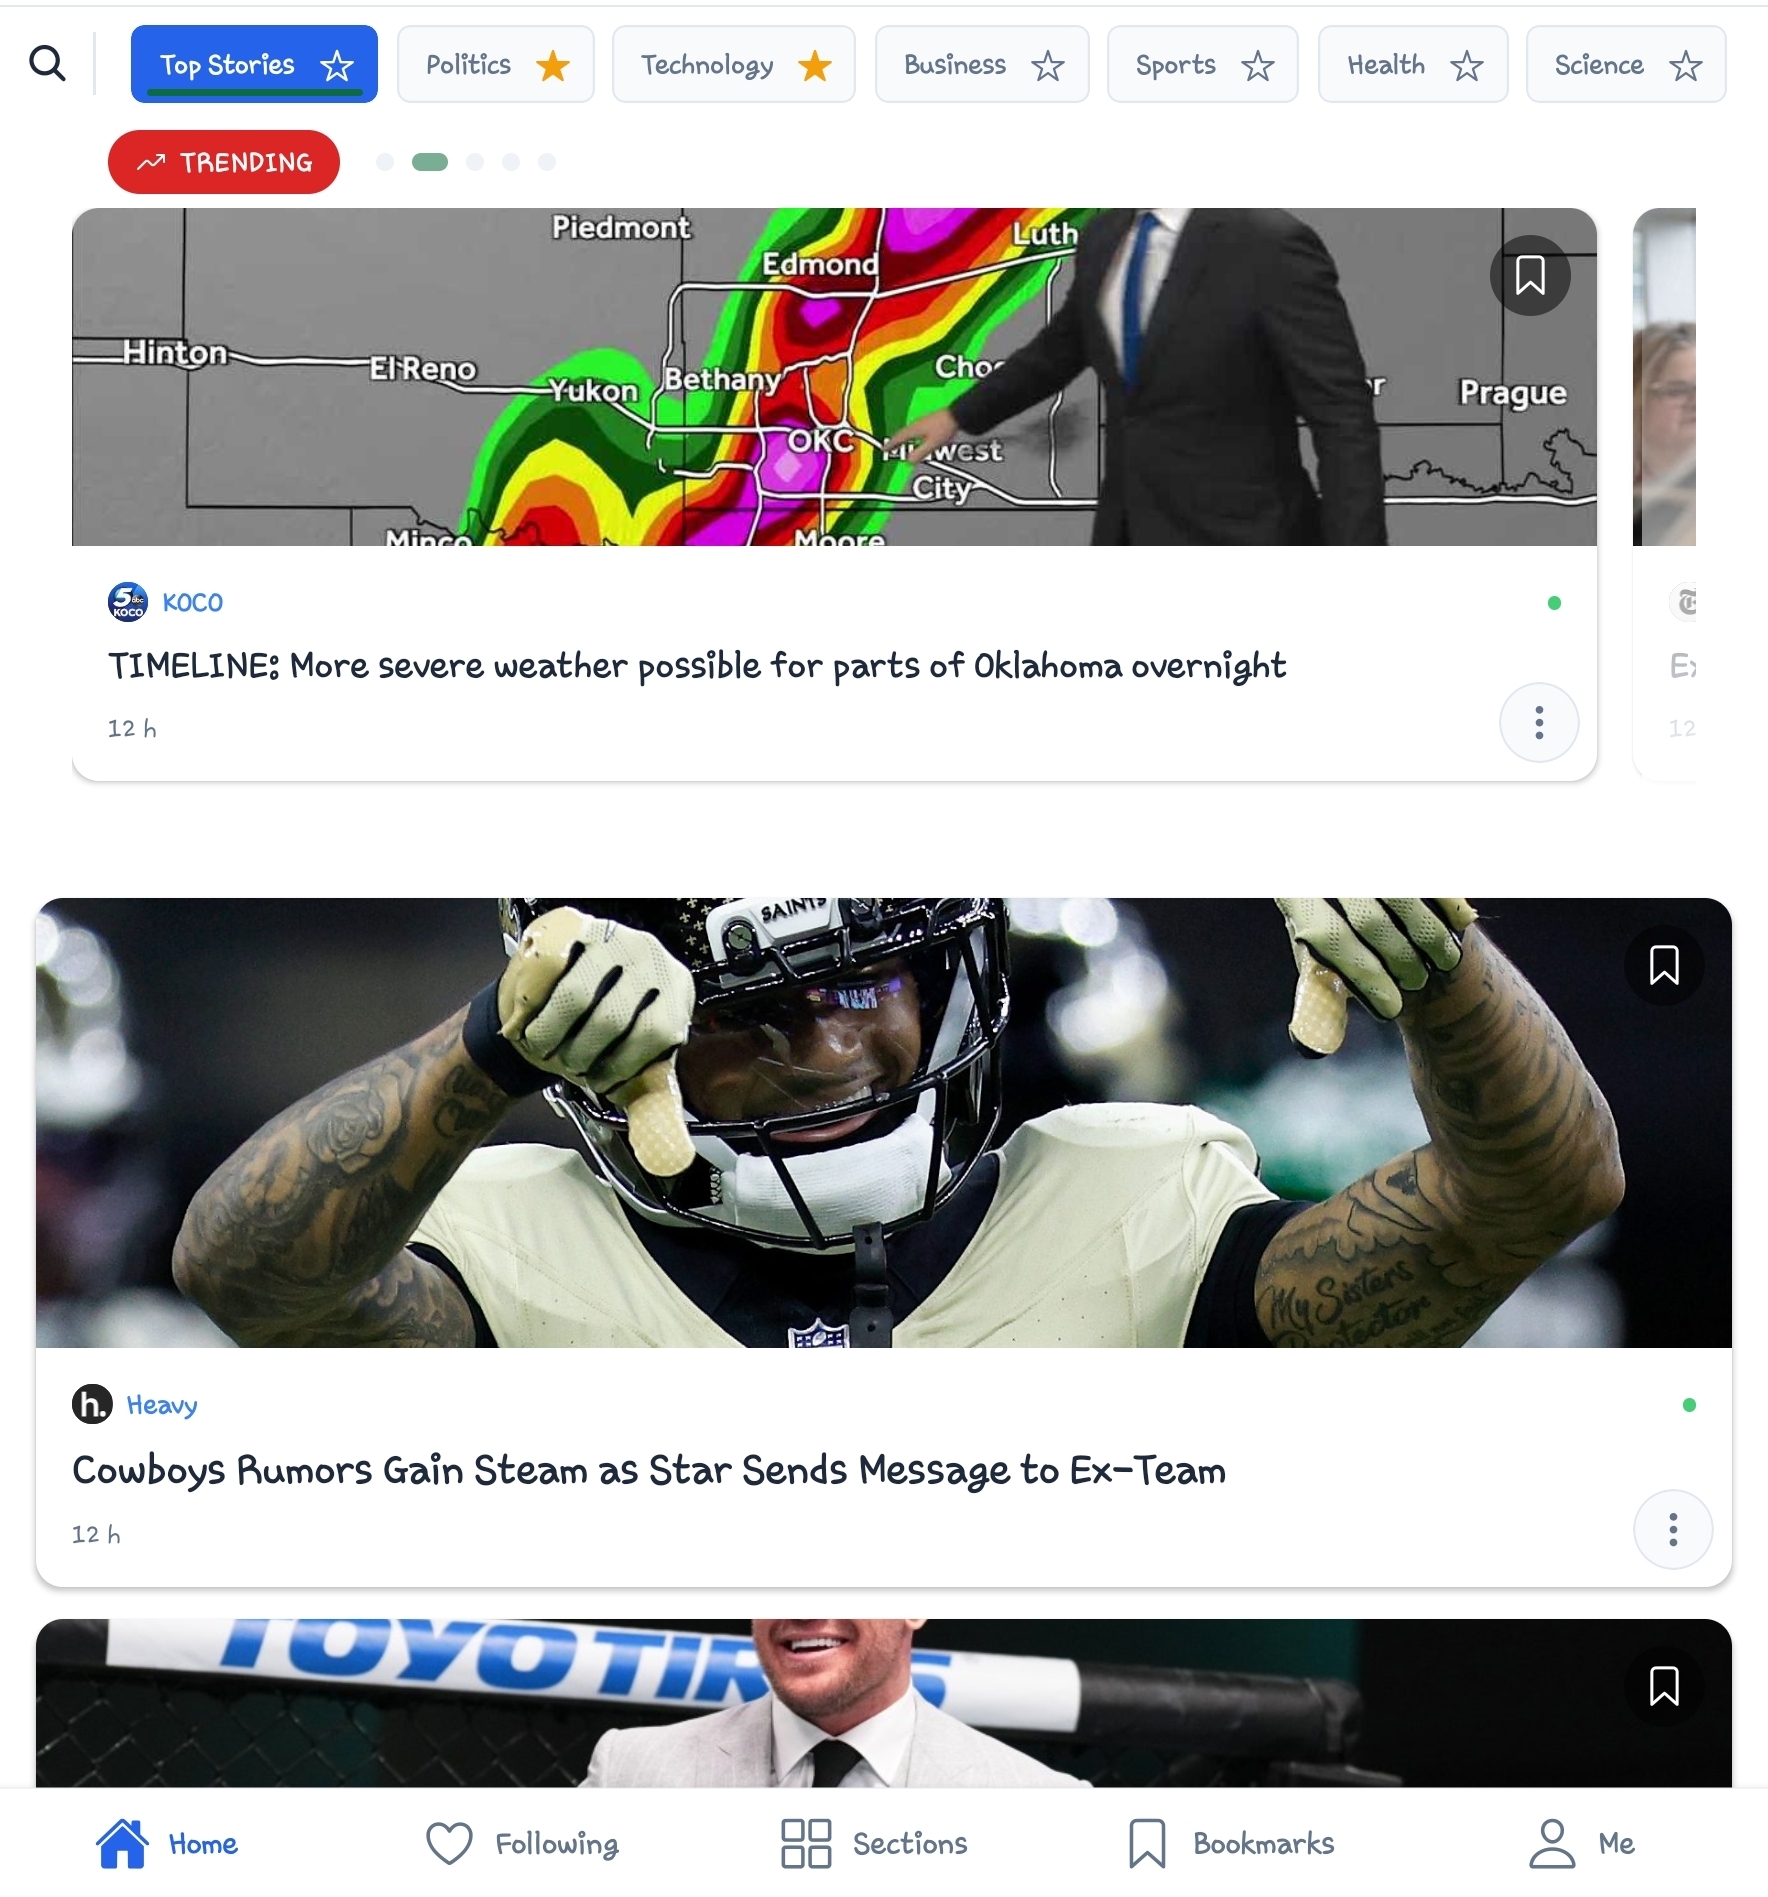
A React and TypeScript news app with country switching, account features, and notification settings.
My role: I developed the app with AI coding assistance as a summer project, using NewsAPI.org for stories and Supabase for the database and authentication.
Recreations & experiments
Independent studies in how visual journalism works—separate from commissioned or published newsroom work.
About
Muhammad Shumail is a visual data journalist for CoStar News and Homes.com based in Arlington, Virginia. His work includes building charts, maps and interactive graphics that turn CoStar Group's commercial and residential real estate data into visual stories.
He previously interned on The Wall Street Journal graphics desk, covering business and markets, and holds a master's degree from the Craig Newmark Graduate School of Journalism at CUNY.
Contact me