← Back to selected work

Homes.com News

What to expect from the upcoming “silver tsunami” of home listings

I pitched a story about how homes owned by older Americans could affect housing markets differently across the country.

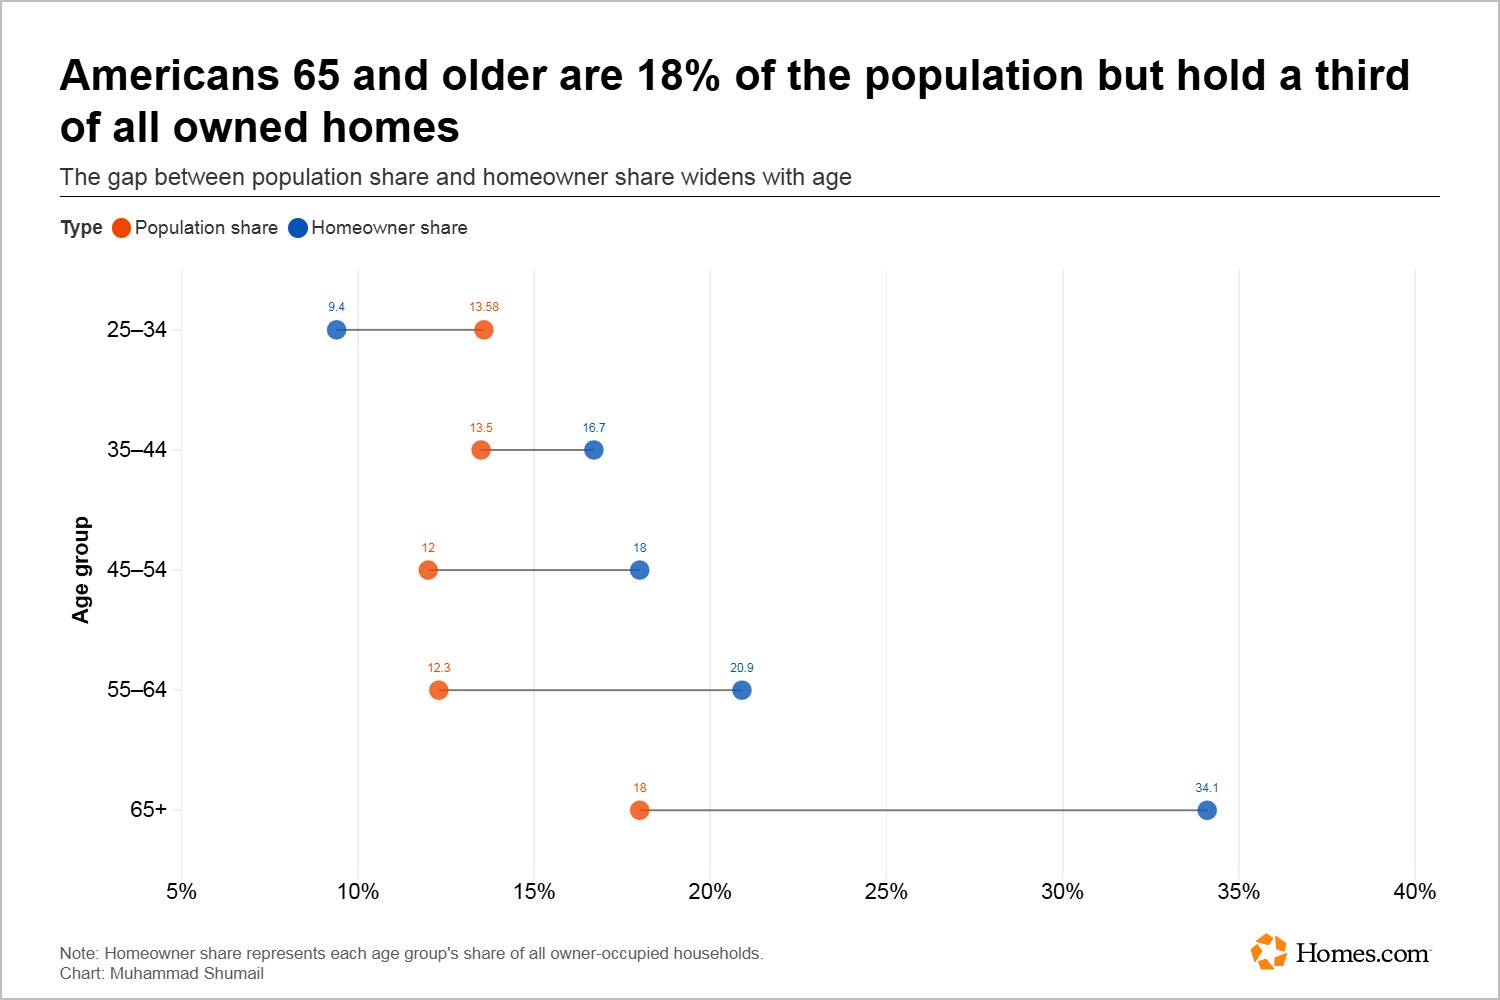
Dot plot comparing population share and share of owner-occupied households by age group; adults 65 and older make up 18% of the population and 34.1% of homeowners.

I pitched a story about how homes owned by older Americans could affect housing markets differently across the country.

Publication
Homes.com News
My role
I pitched the story, found and analyzed the data, and built a map, dot plot, and quadrant chart.

I analyzed data across 40 metro areas. With so many markets and measures to compare, I used a quadrant chart to make the relationship between older homeowners and younger adults forming households easier to see. A map and dot plot helped show the geographic patterns and differences between age groups.

I built the map, dot plot, and quadrant chart in Flourish to compare housing markets and make the patterns in the data easier to see.

Tools: Flourish

It received more than 15,000 views on the Homes.com website and was one of the site’s top-read stories. It was also named Enterprise Story of the Month.

← Back to selected work