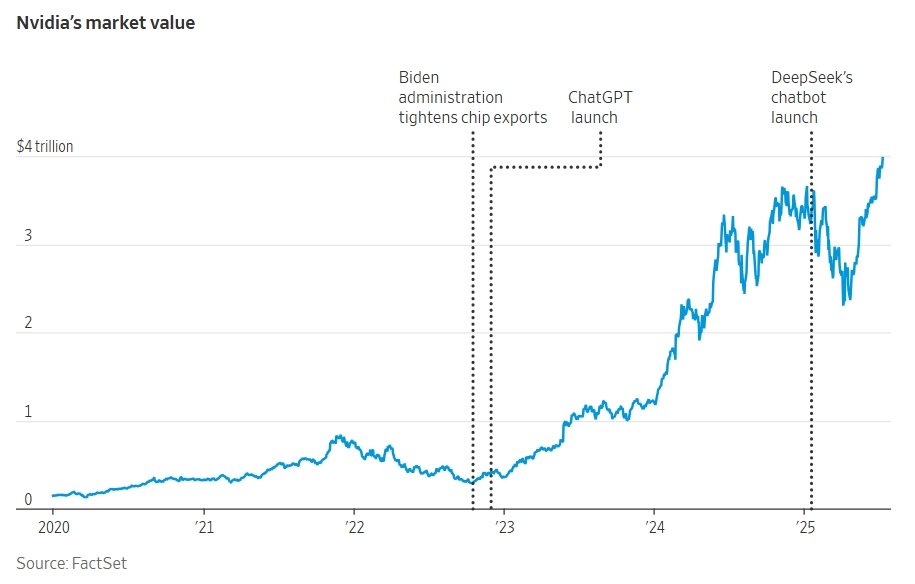
I created charts for breaking coverage of Nvidia crossing $4 trillion in market value.
- Publication
- The Wall Street Journal
- My role
- I designed and built the charts, working with the reporter and editors on the timeline and callouts.
The Wall Street Journal
I created charts for breaking coverage of Nvidia crossing $4 trillion in market value.
01 / The project
I created charts for breaking coverage of Nvidia crossing $4 trillion in market value.
02 / The process
I worked with the reporter and editors to decide which moments to show in the timeline and what to highlight with callouts. Since the story was breaking, I completed the charts in under two hours.
03 / The work
I built the charts with WSJ’s in-house graphics tool, prepared different sizes in Illustrator, and used ai2html to make them responsive.
Tools: WSJ’s in-house graphics tool, Illustrator, and ai2html
04 / The outcome
The charts ran with the story on WSJ’s A1 page online and in the print edition.