← Back to selected work

The Wall Street Journal

Market reactions to Trump’s tweets

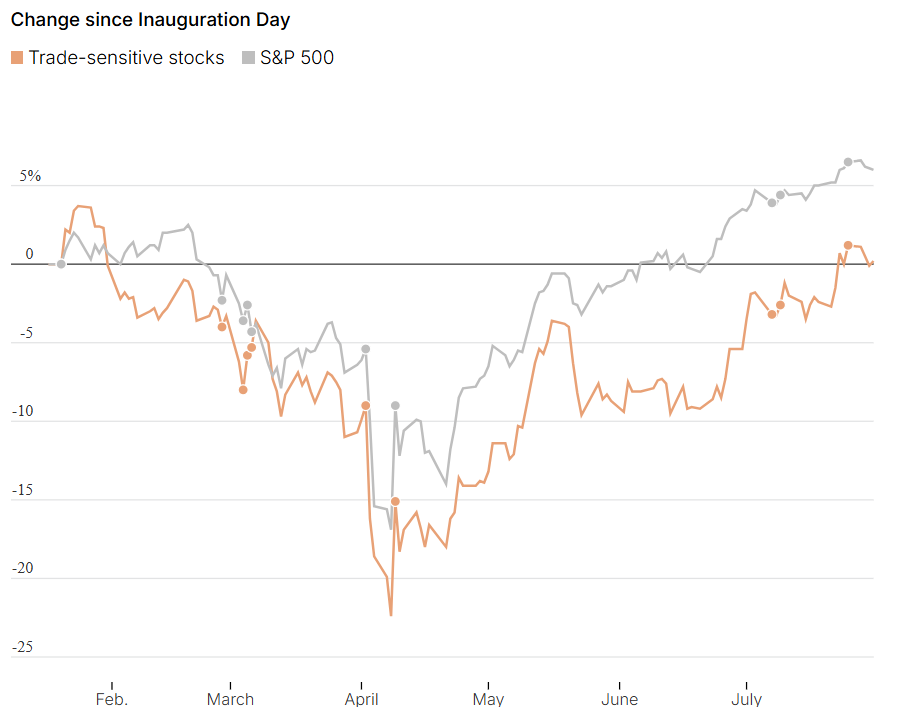
An interactive chart comparing changes in trade-sensitive stocks with the S&P 500 after Inauguration Day.

D3.js interactive chart about market reactions to Trump’s tweets

An interactive chart comparing changes in trade-sensitive stocks with the S&P 500 after Inauguration Day.

Publication
The Wall Street Journal
My role
I built the interactive with data supplied by the data team and implemented it in our WSJ style template.

I chose dates when Trump made notable comments and marked them on the chart. When readers hover over a marked date, a popup shows the comment and highlights both lines so they can compare how the selected stocks and the S&P 500 moved around that time.

I used D3 to build a responsive chart that redraws when its container changes size. It compares the S&P 500 with a custom market-value-weighted index of selected trade-sensitive stocks.

Tools: D3, HTML, CSS, JavaScript, and the WSJ style template

The story was not published, but the finished interactive is available as a standalone project.

← Back to selected work