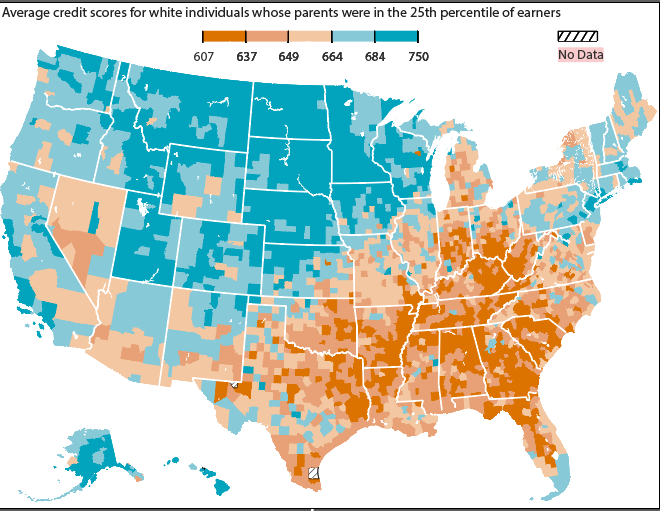
I created county-level maps showing how credit scores varied with people’s childhood neighborhoods.
- Publication
- The Wall Street Journal
- My role
- I built the maps using QGIS and WSJ’s map templates and visual style.
The Wall Street Journal
I created county-level maps showing how credit scores varied with people’s childhood neighborhoods.
01 / The project
I created county-level maps showing how credit scores varied with people’s childhood neighborhoods.
02 / The process
I joined the data using county codes, then added county boundaries and water bodies as map layers in QGIS. I followed WSJ’s map style to keep the maps clear and consistent with the story.
03 / The work
I exported the maps from QGIS, adjusted them in Illustrator, then ran the ai2html script to make them responsive for the web.
Tools: QGIS, WSJ map templates, Illustrator, and ai2html
04 / The outcome
The maps were published with the WSJ story online.