A series of charts showing how HOA construction and home sales have changed over time, across regions, and at different price points.
- Publication
- Homes.com
- My role
- I requested the data from NAHB, analyzed it, and built the charts in Flourish.
Homes.com
A series of charts showing how HOA construction and home sales have changed over time, across regions, and at different price points.
01 / The project
A series of charts showing how HOA construction and home sales have changed over time, across regions, and at different price points.
02 / The process
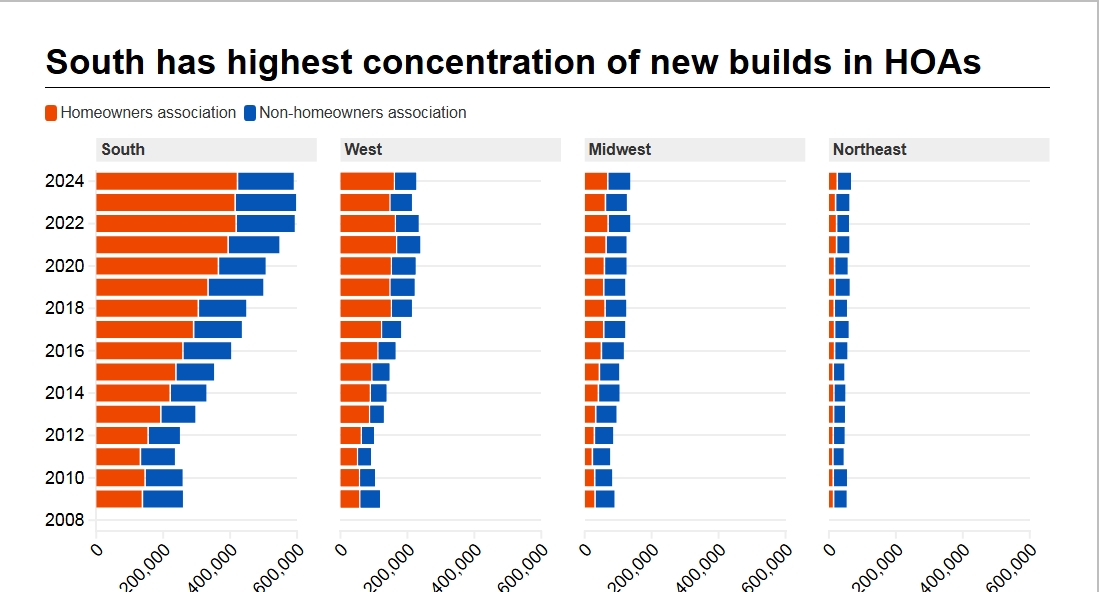
I split the data into several views rather than trying to fit everything into one chart. A national comparison showed construction inside and outside HOAs, while regional charts showed where most of that building was happening. I used a heatmap to show sales over time and separate line charts to compare HOA and non-HOA sales within each price range.
03 / The work
I built a national construction comparison, regional stacked bar charts, a sales heatmap, and small-multiple line charts by sale price.
Tools: Flourish
04 / The outcome
Homes.com News published the charts with the story, showing how HOA construction and sales differed across regions and price ranges.