← Back to selected work

The Wall Street Journal

The biggest companies across America are cutting their workforces

I analyzed how sales and employment changed over time at some of America’s largest companies.

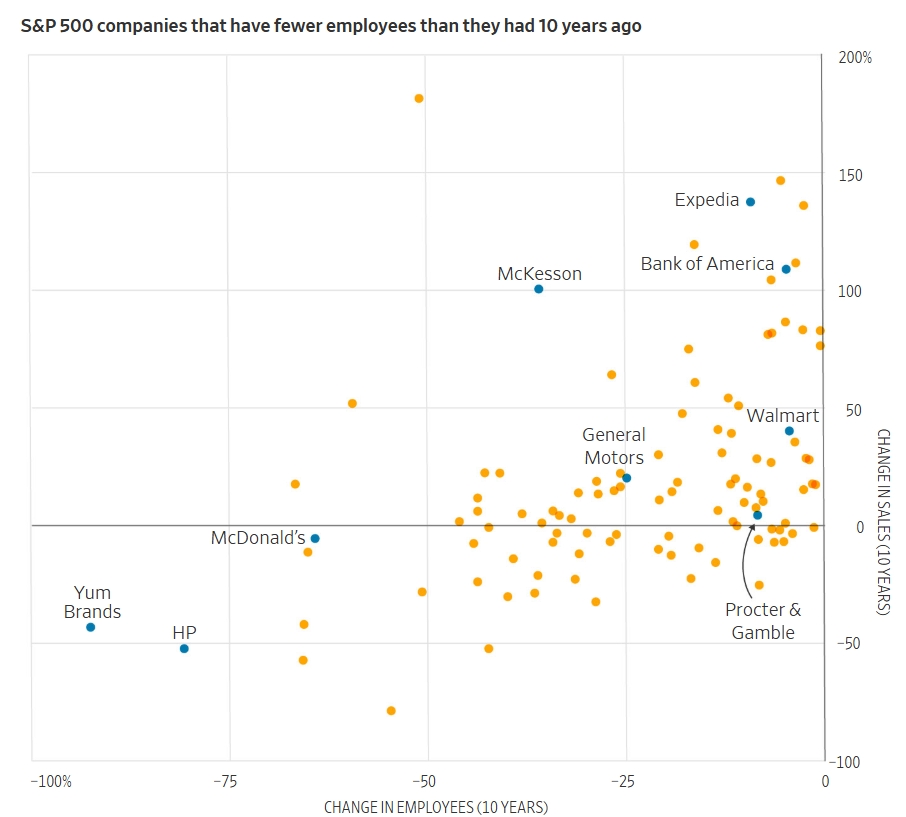
Scatter plot comparing sales and employee changes for S&P 500 companies

I analyzed how sales and employment changed over time at some of America’s largest companies.

Publication
The Wall Street Journal
My role
I worked with the reporter and editor to explore the data, shape the analysis, and build graphics for the story.

This was my first project. I started with a large set of raw data and an open-ended question: could I find a trend? I met with the reporter and editor to understand the story, explored the data, and brought what I found back to them. Comparing year-over-year changes in sales and employment made the patterns easier to see than plotting raw numbers. After reading the story draft, I highlighted the companies it mentioned in the charts.

I built the graphics with WSJ’s graphics tool, then adjusted them in Illustrator for different screen sizes while keeping the callouts and dimensions in place. I ran the ai2html script and added the graphics to the story.

Tools: WSJ’s graphics tool, Illustrator, and ai2html

The story and my graphics were published online and in print. The story also ranked among the top 10 most-read stories on our newsroom leaderboard.

← Back to selected work